In the world of technical analysis and candlestick charting, the Doji candlestick pattern stands out as a unique and intriguing formation. Named after the Japanese word for “at the same time” or “indecision,” the Doji represents a period of equilibrium between buyers and sellers. In this article, we will delve into the characteristics of the Doji candlestick pattern, its significance in trading, and how traders use it to make informed decisions.

Understanding the Doji Candlestick
The Doji candlestick is characterized by its distinctive shape, featuring a small body with almost equal opening and closing prices. The most critical element of a Doji is its extremely short or non-existent body, which creates a horizontal line. However, what truly defines a Doji is the presence of wicks or shadows extending above and below the body, indicating significant price fluctuations during the trading session.
Types of Doji Candlesticks
There are several variations of the Doji candlestick pattern, each with slightly different implications for traders:
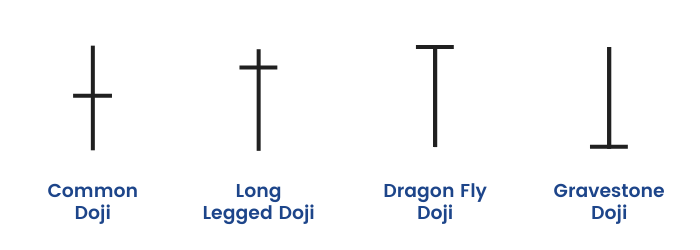
- Classic Doji: In a classic Doji, the opening and closing prices are virtually identical, resulting in a very short or non-existent body. This pattern signifies a state of market indecision.
- Long-Legged Doji: A Long-Legged Doji has long upper and lower wicks, indicating that price volatility was high during the trading session. Traders view this pattern as a sign of extreme uncertainty in the market.
- Dragonfly Doji: A Dragonfly Doji is characterized by a long lower wick and little to no upper wick. It often suggests that sellers initially pushed prices lower, but buyers regained control by the end of the session.
- Gravestone Doji: The Gravestone Doji features a long upper wick and little to no lower wick. This pattern implies that buyers initially pushed prices higher, but sellers took control by the session’s close.
Significance in Trading
The Doji candlestick pattern holds significant importance in technical analysis for several reasons:
- Indecision: The primary message of a Doji is market indecision. It represents a temporary equilibrium between buyers and sellers, indicating uncertainty about the future direction of the asset’s price.
- Reversal Signal: When a Doji forms after a prolonged uptrend or downtrend, it can signal a potential trend reversal. For example, a Doji after a strong uptrend may indicate that buyers are losing momentum, potentially leading to a reversal.
- Continuation Signal: In some cases, a Doji can act as a continuation signal. If a Doji appears in the middle of a trend, it suggests that the trend is pausing temporarily before resuming its previous direction.
- Support and Resistance: Doji candlesticks often form near support or resistance levels, indicating areas where price reversals or consolidations may occur.
Trading Strategies with Doji Candlesticks
Traders use Doji candlesticks as part of their trading strategies in various ways:
- Confirmation: Traders may wait for confirmation in the form of a subsequent price move after a Doji. For instance, if a Doji appears after a downtrend and is followed by a bullish candle, it may signal a potential reversal.
- Stop Placement: Doji candlesticks can help traders place effective stop-loss orders. Placing stops just below or above a Doji can limit potential losses in case of a reversal.
- Filter for Other Indicators: Traders often use Doji patterns in conjunction with other technical indicators to make more informed trading decisions. For example, they may look for Doji patterns near overbought or oversold conditions on an oscillator like the Relative Strength Index (RSI).
Conclusion
The Doji candlestick pattern is a valuable tool in the arsenal of technical analysts and traders. Its ability to convey market indecision and its potential for signaling reversals or continuations make it a versatile pattern. However, it’s essential to remember that Doji patterns are most effective when considered alongside other technical indicators and in the context of the broader market environment. By understanding and interpreting the Doji pattern, traders can gain valuable insights into market sentiment and potential price movements.